Calculate what one control room event really costs | Try our free ROI calculator


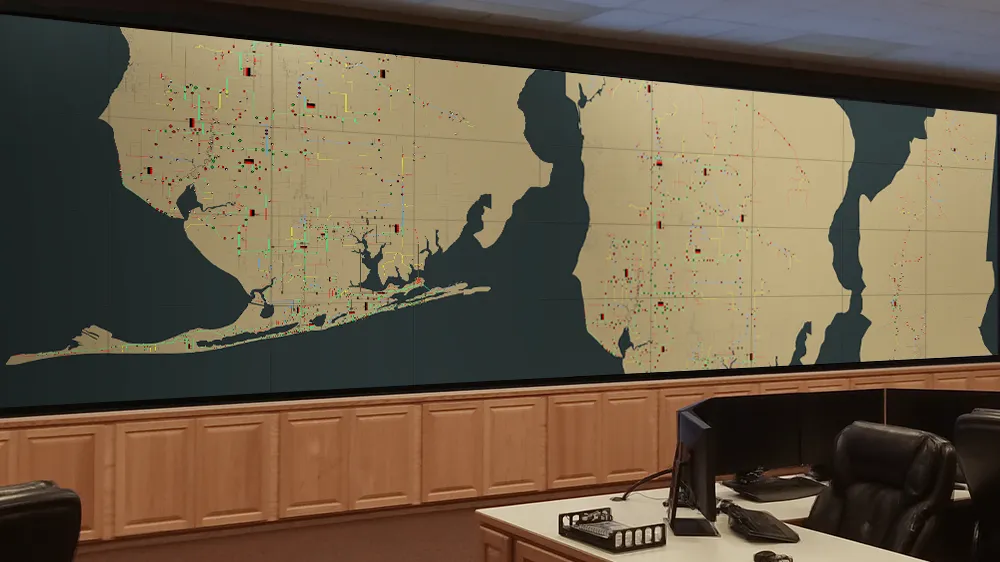
Meet FERC 881 compliance and uncover the real limits of your grid with live AAR and DLR insights. Primate’s dynamic line rating system visualization shows operators exactly how much power each line can safely carry in real time.
These dashboards fuse Ambient Adjusted Ratings (AAR) and Dynamic Line Ratings (DLR) into one intuitive view, revealing hidden capacity, reducing transmission congestion, and driving faster, smarter operational decisions.


For decades, transmission lines have been managed using conservative static ratings. FERC Order 881 now requires utilities to adopt Ambient Adjusted Ratings (AARs) as a baseline and encourages Dynamic Line Ratings (DLRs) where appropriate.
These methodologies calculate line capacity based on real environmental conditions like wind, temperature, and solar heating rather than fixed seasonal assumptions. With AAR and DLR, operators can:
Unlock hidden transmission capacity without new infrastructure
Improve grid reliability and reduce overload risks
Better transmission congestion management & lower costs
Support renewable integration by reducing transmission bottlenecks
Ensure compliance with FERC 881 by providing transparent methodologies
Implementing AAR and DLR introduces measurable efficiency gains, but it also transforms how operators manage their grids day to day. With a dynamic line rating system, transmission limits fluctuate hourly as weather conditions change, requiring operators to constantly interpret new data while maintaining system reliability.
Legacy SCADA and EMS environments built for static ratings weren’t designed for this level of dynamism. Now, utilities must integrate high-frequency updates, visualize complex thermal and environmental inputs, and adjust dispatch decisions in real time.
Without a grid optimization software, these rating shifts can increase operator workload and complicate contingency response, especially during fast-changing grid conditions.

Primate brings AAR and DLR data into one clear view, turning real-time ratings into actionable insight. Operators can monitor capacity, weather impacts, and compliance metrics side by side, without switching systems.
Unified dashboards combining AAR, DLR, SCADA, and weather data
Custom visualizations aligned with your operator workflows
Replay and historian tools for training and event review
Audit-ready reporting to support compliance and regulators
Two decades of control room visualization experience across transmission, distribution, and generation environments.
Proven performance in control centers across North America, supporting operators who depend on reliable, real-time visualization.
Built to turn complex, high-frequency data into clear displays that operators can trust during both routine operations and contingencies.
• Support your team’s transition to full FERC 881 implementation
• Gain clearer awareness of available capacity to improve operations
• Simplify adoption with a single platform for visualization and reporting
• Extend your current dashboards with AAR and DLR monitoring
• Eliminate the need for separate systems or one-off tools
• Prepare your control room for the future of transmission operations


See if your control room is prepared to support AAR and DLR across visibility, data, and operations.
Check Readiness →