Control room with multi-screen display featuring real-time operational data and geographic mapping

Control Room Display Design

Turn high-volume system data into clear, reliable control room displays that help operators react faster, reduce uncertainty, and maintain awareness across every screen in the room.

From Weeks to Hours: $150K Saved Every Year

Primate’s Network Model lets operators complete grid updates in 4 hours instead of 80, cutting dependency on engineers, eliminating backlogs, and typically saving over $150,000 per year in labor costs.

$150K+

annual labor savings

96%

faster update time

Real-Time Monitoring vs $6.7B Blackout

During the 2003 Northeast blackout, alarm failures left operators blind for over 90 minutes.Primate’s real-time EMS health monitoring would have caught the failure instantly, preventing cascading outages and billions in economic losses.

$6.7B

loss avoided

90+

min faster operator response

Preventing $1M-a-Day Penalties

NERC violations for missed contingencies can cost utilities millions daily. Primate continuously monitors data quality and system limits, instantly flagging potential breaches to help keep operations compliant and penalty-free.

$1M/day

fines prevented

3

key NERC standards covered

One Visualization. $100M in Mission Costs Saved

A detected anomaly nearly grounded a million-dollar launch. Primate’s visualization revealed it was outside the critical zone, preventing an unnecessary cancellation and saving hundreds of millions in wasted preparation.

$100-$150M

loss avoided

0

false aborts

Turning $1.7M Outages Into Minutes of Downtime

Average grid outages last 5.8 hours and cost $1.7M in downtime and penalties. Primate’s fault detection helps operators isolate and resolve issues fast, often restoring power in minutes instead of hours.

$1.7M

saved per outage

5.8hrs = minutes

recovery time

Stopping $300K-an-Hour Downtime Before It Starts

Each hour of downtime costs electric utilities around $300K. Primate’s continuous visualization spots anomalies before they escalate, keeping systems online, reliable, and efficient around the clock.

$300K/hr

loss prevented

24/7

intelligent alarming

Why Control Rooms Need Smarter Displays

Most control room displays fall short because they’re built around generic layouts, outdated assumptions, or hardware-first design. Operators end up fighting cluttered screens, blurry visuals, and displays that don’t match how the system actually runs. 

In high-pressure environments, that gap slows decisions and increases the risk of missed signals. Primate solves this by designing control room displays around real operational workflows and established viewing standards, rather than relying on generic or outdated templates.

Control room with multiple monitors displaying a detailed city map, power grid data, and graphs, with a person seated at the center workstation.

See how much a control room event costs your business

Why Primate Technologies?

Primate’s SASYS℠ process ensures every control room display is purpose-built for your environment. Through a collaborative design approach, we create refined, high-clarity displays that strengthen situational awareness and support faster, more confident decision-making.

Square with a star inside, symbolizing guided design support

Assisted Design Process

Collaborative control room display design that blends your system expertise with Primate’s decades of operational insight.

Puzzle piece icon representing real-time object and symbol linking

Dynamic Configuration

Real-time adjustments to on-screen elements so control room displays stay accurate as data, conditions, and priorities shift.

Expand arrows icon indicating optimized display visualization

Optimized Viewing

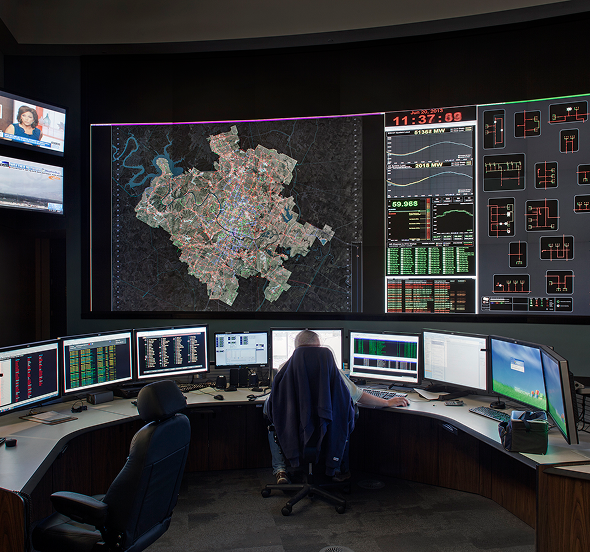
Control room displays tuned for LCD, LED, and video walls to ensure crystal-clear visibility at any distance.

Directional cross icon for seamless desktop control and navigation

Intuitive Navigation

Smooth pan and zoom controls that let operators move through complex displays without losing context or clarity.

Lightning bolt icon symbolizing streamlined information delivery

Enhanced Performance

Streamlined information delivery that reduces operator overload and keeps critical data readable under pressure.

Padlock icon representing cyber-secure data extraction

Secure Implementation

Designed to operate within secure customer environments, with optional encryption and security controls applied where required.

Checkmark icon for video wall design compatibility validation

Verification

Direct collaboration with your video wall provider to confirm full compatibility and ensure display designs perform as expected.

Checkmark icon for video wall design compatibility validation

Operator-Centric Layouts

Control room displays structured around real workflows so operators see the right information first, not buried data.

Checkmark icon for video wall design compatibility validation

Scalable Display Architecture

Layouts built to expand with your operation, supporting new assets, views, and data sources without redesigning your display. 

See how much a control room event costs your business

Superior Video Wall Display Solutions

Control room displays only work if they stay sharp and consistent at wall size. Primate’s video wall solutions deliver scalable, crystal-clear visualization across every configuration, ensuring operators get the same precise view whether they’re at a workstation or facing a full-size wall.

Seamless multi-screen integration keeps information flowing without gaps or distortion, and remote access support ensures your team sees the same high-quality display from any authorized location.

Learn More
Control room with a large video wall displaying real-time data and multi-screen workstation setup

Built For Teams Who Can’t Afford Display Failures

When your operation depends on constant visibility, control room displays are the backbone of every decision your operators make.  With Primate, you get displays that match the way your control room actually runs. No distortion. No mismatched data. No surprises at scale. Just consistent, dependable visibility that your operators trust in every state of the system.

Detailed control room schematic with colored circuit paths, representing intelligent data integration

See how our displays perform when it matters most

Request a Demo

Frequently Asked
Questions

What makes your control room displays readable from long viewing distances?
Primate’s displays rely on vector-based graphics, precise pixel alignment, and layouts optimized for distance viewing. This ensures schematics, text, and alerts remain crisp and legible across different monitor types, whether viewed up close or from across the control room.
How do control room displays prevent information overload?
Well-designed displays like Primate prioritize visual hierarchy. Critical data stays prominent, while secondary layers minimize clutter. This helps operators maintain focus when switching events, alarms, or weather data all update at once.
Can your control room displays handle multiple data sources without slowing down?
Yes. Primate’s control room displays use optimized rendering engines that selectively update only the elements that change. This keeps visuals smooth even when SCADA, GIS, weather, and security feeds update simultaneously.
What’s the difference between desktop displays and large video wall displays?
Desktop screens support detailed operator views, while video walls provide wide-area situational awareness. High-quality systems like Primate keep both display types synchronized so every operator sees the same up-to-date information.
How often should our control room displays be updated?
Most teams refresh displays when assets change, new data feeds are added, or workflows evolve. A flexible display system like Primate makes these updates quick, avoiding long redesign cycles or downtime during operational changes.
Assessment Tool

Is your control room ready for AAR and DLR?

See if your control room is prepared to support AAR and DLR across visibility, data, and operations.

Check Readiness →