Data Wall Display Software

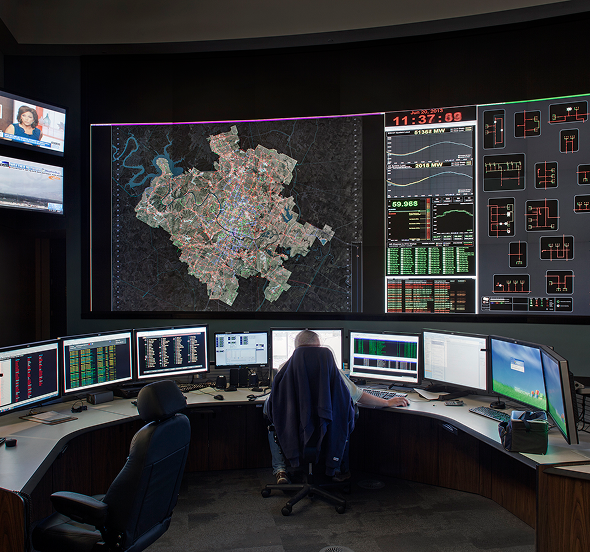
Primate’s data wall display software turns complex, fast-moving operational data into a clear, structured visual environment that teams can interpret instantly. Instead of overwhelming operators with more screens, it organizes what matters into a single, readable view that supports real decisions in real time.

From Weeks to Hours: $150K Saved Every Year

Primate’s Network Model lets operators complete grid updates in 4 hours instead of 80, cutting dependency on engineers, eliminating backlogs, and typically saving over $150,000 per year in labor costs.

$150K+

annual labor savings

96%

faster update time

Real-Time Monitoring vs $6.7B Blackout

During the 2003 Northeast blackout, alarm failures left operators blind for over 90 minutes.Primate’s real-time EMS health monitoring would have caught the failure instantly, preventing cascading outages and billions in economic losses.

$6.7B

loss avoided

90+

min faster operator response

Preventing $1M-a-Day Penalties

NERC violations for missed contingencies can cost utilities millions daily. Primate continuously monitors data quality and system limits, instantly flagging potential breaches to help keep operations compliant and penalty-free.

$1M/day

fines prevented

3

key NERC standards covered

One Visualization. $100M in Mission Costs Saved

A detected anomaly nearly grounded a million-dollar launch. Primate’s visualization revealed it was outside the critical zone, preventing an unnecessary cancellation and saving hundreds of millions in wasted preparation.

$100-$150M

loss avoided

0

false aborts

Turning $1.7M Outages Into Minutes of Downtime

Average grid outages last 5.8 hours and cost $1.7M in downtime and penalties. Primate’s fault detection helps operators isolate and resolve issues fast, often restoring power in minutes instead of hours.

$1.7M

saved per outage

5.8hrs = minutes

recovery time

Stopping $300K-an-Hour Downtime Before It Starts

Each hour of downtime costs electric utilities around $300K. Primate’s continuous visualization spots anomalies before they escalate, keeping systems online, reliable, and efficient around the clock.

$300K/hr

loss prevented

24/7

intelligent alarming

Better Display = Better Awareness

A larger wall does not automatically create a better control room. In many environments, the wall becomes a collection of stretched desktop apps, mismatched dashboards, and hard-to-read panels that were never designed for distance viewing. Operators can technically “see” more, but they understand less.

That is the gap Primate closes.

Our data wall display software is built for operational visibility, not generic screen sharing. It organizes live information into a visual structure that helps operators identify status, context, and risk faster, without forcing them to decode a wall full of noise.

Control room with multiple monitors displaying a detailed city map, power grid data, and graphs, with a person seated at the center workstation.
Person monitoring GridGuardian BlackBoard event and network flow displayed on dual computer screens at a control station.

Multiple Systems Into One Usable Picture

Control rooms often depend on several systems at once, including SCADA, GIS, EMS, OMS, historian platforms, weather feeds, and other operational inputs. When those systems live in separate tools, operators are forced to interpret them mentally and connect the dots.

Primate brings those inputs together into a unified display environment so teams can monitor relationships, not just raw signals. 

Instead of switching between windows to understand what is happening, operators can view the operational picture as a connected whole. That matters in normal operations, and it matters even more during abnormal ones.

Performance-Driven Display Technology

Primate is powered by four core technologies that work together to deliver fast, reliable, and distortion-free visualization for control rooms.

GridGuardian™

Mission-Critical Data Engine

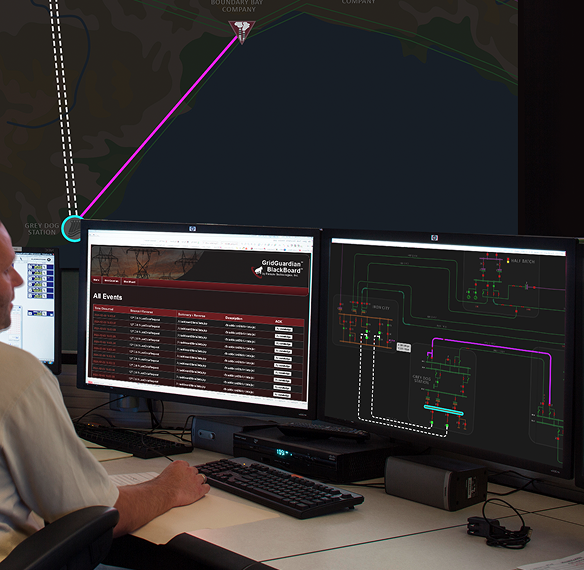
GridGuardian™ is an advanced data aggregation platform that consolidates and processes real-time control room data into actionable intelligence for enhanced situational awareness and decision-making.

Learn More
Control room operator using GridGuardian software to monitor real-time system data and alerts

TileViewer

Display Without Boundaries

TileViewer enables secure, multi-platform access to critical control room displays, ensuring consistent visualization from video walls to mobile devices. 

Learn More
Woman looking at desktop computer screen with product screenshot

BlackBoard™

Display Without Limits

BlackBoard™ delivers crystal-clear visualization of control room data across multiple displays while maintaining precision and eliminating distortion at any scale.

Learn More
Control room operator using BlackBoard for real-time system visualization across multiple displays

TileBuilder

Lightning-Fast Rendering

TileBuilder accelerates visualization of complex control room data through advanced rendering technology, delivering instant, real-time display updates.

Learn More
Operator using TileBuilder for real-time rendering of complex control room data on multiple monitors

Discover Primate’s data wall display solutions

Show the Right Data at the Right Moment

A useful data wall display should highlight what matters now, not dump every available input onto the screen at once. During routine operations, teams may need a stable overview of network health, asset status, or performance metrics. 

But during an event, priorities shift. The wall may need to emphasize alarms, geographic impact, outage progression, crew locations, or restoration status.

Primate supports that shift by making the wall operationally adaptable. Layouts can be configured around the way teams work, and views can change as operational priorities change. The result is a display environment that supports real decisions instead of becoming a static backdrop.

Support the Entire Operational Ecosystem

In many control rooms, the wall is the only place where multiple stakeholders can quickly align around the same picture. Operators, supervisors, engineers, dispatch teams, and leadership all rely on that shared visual reference when events escalate.

If the wall is inconsistent, cluttered, or out of sync with desktop views, coordination slows down and response quality drops.

Primate helps create a common operating picture across the room and beyond it. The same visual logic can extend across large walls, operator workstations, and authorized remote environments, helping teams collaborate from the same operational context rather than separate interpretations.

Designed for Real Infrastructure Environments

Primate is built for environments where teams monitor infrastructure, system health, alarms, and changing conditions across large, interconnected operations. The result is stronger situational awareness, faster interpretation, and better use of the wall as a real part of control room operations.

Improve your data wall display environment

Request a Demo

Frequently Asked
Questions

What is a data wall display?
A data wall display is a large-format visual environment used to present live operational information across one or more screens. In control rooms, it helps teams monitor system conditions, alarms, asset status, and other critical data in a shared, easy-to-interpret format.
How is a data wall display different from a standard display wall?
A standard display wall may simply show multiple feeds or applications side by side. A data wall display is designed to present operational information in a structured way, helping teams interpret live data quickly rather than just showing more content on a larger surface.
What types of data can be shown on this data wall display?
Primate’s data wall display can show information from SCADA, GIS, EMS, OMS, historian systems, weather data, alarms, security systems, and other operational platforms. The goal is to bring those inputs into a unified visual environment that supports faster understanding and response.
Why does display readability matter in a control room?
If operators cannot read or interpret the wall quickly, the display loses operational value. Clear scaling, strong visual hierarchy, and layouts designed for distance viewing help teams understand system conditions faster and reduce confusion during high-pressure situations.
Can this data wall display support multiple teams at once?
Yes. Primate’s data wall display helps create shared situational awareness across operators, supervisors, engineers, and remote stakeholders. When everyone is working from the same visual picture, coordination improves and decisions happen faster.
Assessment Tool

Is your control room ready for AAR and DLR?

See if your control room is prepared to support AAR and DLR across visibility, data, and operations.

Check Readiness →