Control Room Technology

Primate’s control room technology gives operators a clear understanding of complex systems without forcing them to jump between tools, screens, or disconnected data. Instead of adding more dashboards or software layers, it brings everything into a single structured environment designed for consistent decision-making.

From Weeks to Hours: $150K Saved Every Year

Primate’s Network Model lets operators complete grid updates in 4 hours instead of 80, cutting dependency on engineers, eliminating backlogs, and typically saving over $150,000 per year in labor costs.

$150K+

annual labor savings

96%

faster update time

Real-Time Monitoring vs $6.7B Blackout

During the 2003 Northeast blackout, alarm failures left operators blind for over 90 minutes.Primate’s real-time EMS health monitoring would have caught the failure instantly, preventing cascading outages and billions in economic losses.

$6.7B

loss avoided

90+

min faster operator response

Preventing $1M-a-Day Penalties

NERC violations for missed contingencies can cost utilities millions daily. Primate continuously monitors data quality and system limits, instantly flagging potential breaches to help keep operations compliant and penalty-free.

$1M/day

fines prevented

3

key NERC standards covered

One Visualization. $100M in Mission Costs Saved

A detected anomaly nearly grounded a million-dollar launch. Primate’s visualization revealed it was outside the critical zone, preventing an unnecessary cancellation and saving hundreds of millions in wasted preparation.

$100-$150M

loss avoided

0

false aborts

Turning $1.7M Outages Into Minutes of Downtime

Average grid outages last 5.8 hours and cost $1.7M in downtime and penalties. Primate’s fault detection helps operators isolate and resolve issues fast, often restoring power in minutes instead of hours.

$1.7M

saved per outage

5.8hrs = minutes

recovery time

Stopping $300K-an-Hour Downtime Before It Starts

Each hour of downtime costs electric utilities around $300K. Primate’s continuous visualization spots anomalies before they escalate, keeping systems online, reliable, and efficient around the clock.

$300K/hr

loss prevented

24/7

intelligent alarming

For Control Rooms That Crumble Under Pressure

On paper, most control rooms look well-equipped.In reality, operators are often stitching together information manually. SCADA shows one thing, mapping tools show another, alerts come in separately, and historical context lives somewhere else entirely.

During routine operations, that’s inefficient. During an incident, it becomes a real risk.

Teams lose time validating information, cross-checking sources, and trying to understand what is actually happening. The technology exists, but it is not working as a system. And that’s exactly what Primate solves.

Control room with multiple monitors displaying a detailed city map, power grid data, and graphs, with a person seated at the center workstation.
Person monitoring GridGuardian BlackBoard event and network flow displayed on dual computer screens at a control station.

Bring All Operational Systems Into One View

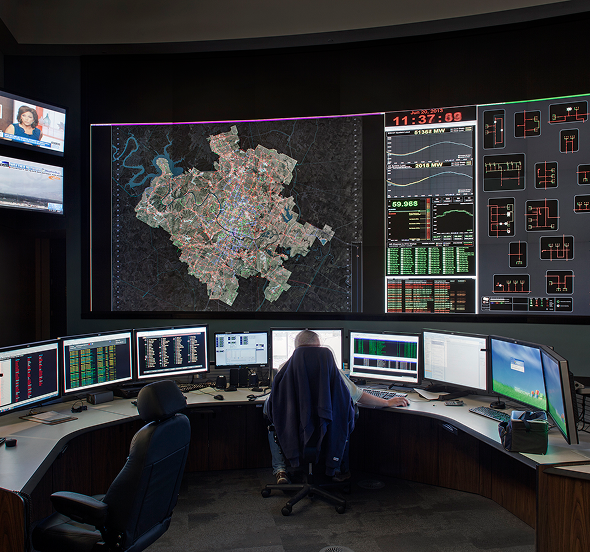
Primate’s control room technology integrates data from systems like SCADA, EMS, GIS, OMS, historian platforms, and external feeds into a single operational environment. Instead of switching between tools, operators see how systems relate to each other in real time.

This is not about stacking data on one screen. It is about structuring it so relationships become obvious.

Operators can identify cascading issues faster, understand cause and impact without guesswork, and respond with full context instead of partial information.

Performance-Driven Display Technology

Primate is powered by four core technologies that work together to deliver fast, reliable, and distortion-free visualization for control rooms.

GridGuardian™

Mission-Critical Data Engine

GridGuardian™ is an advanced data aggregation platform that consolidates and processes real-time control room data into actionable intelligence for enhanced situational awareness and decision-making.

Learn More
Control room operator using GridGuardian software to monitor real-time system data and alerts

TileViewer

Display Without Boundaries

TileViewer enables secure, multi-platform access to critical control room displays, ensuring consistent visualization from video walls to mobile devices. 

Learn More
Woman looking at desktop computer screen with product screenshot

BlackBoard™

Display Without Limits

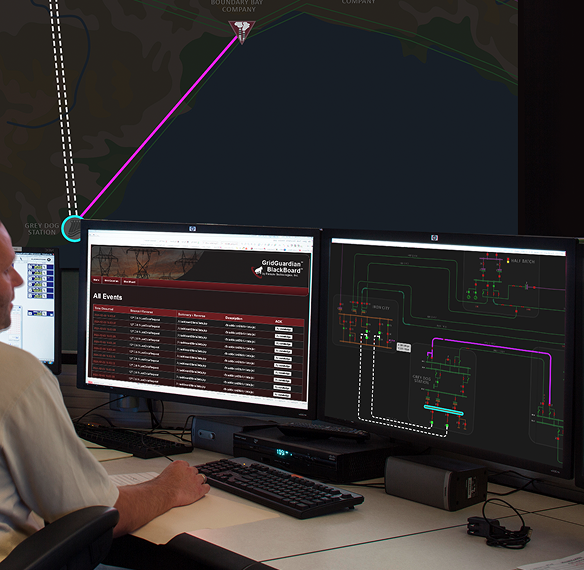
BlackBoard™ delivers crystal-clear visualization of control room data across multiple displays while maintaining precision and eliminating distortion at any scale.

Learn More
Control room operator using BlackBoard for real-time system visualization across multiple displays

TileBuilder

Lightning-Fast Rendering

TileBuilder accelerates visualization of complex control room data through advanced rendering technology, delivering instant, real-time display updates.

Learn More
Operator using TileBuilder for real-time rendering of complex control room data on multiple monitors

Discover Primate’s control room technology

Make Complex Systems Instantly Understandable

Most control room tools present information in formats that require experience and effort to decode. Dense tables, disconnected alerts, and overloaded dashboards slow down understanding when speed matters most.

Primate’s control room technology transforms that data into visual formats designed for rapid comprehension. System states, anomalies, and risks are represented clearly so operators can assess conditions at a glance.

Instead of reading through layers of data, teams see what matters immediately and act without hesitation.

Keep Every Operator Aligned in Real Time

In many environments, different teams rely on different tools and views of the same system. What appears on the video wall may not match what an operator sees at their desk, and remote teams often work from yet another version.

That disconnect leads to delays, miscommunication, and inconsistent decisions. Primate creates a shared operational picture across all environments. The same structured view can be accessed across control room displays, workstations, and authorized remote locations.

Everyone works from the same information, updated at the same time, with the same visual logic. That alignment is what allows teams to move quickly and confidently during high-pressure situations.

Wind farm with overlaid data graphs, representing intelligent data processing and real-time analytics

Built for High-Stakes Operational Environments

Control room technology only matters in environments where decisions carry real consequences. Primate is designed for teams responsible for monitoring and responding to complex, real-time systems where delays and blind spots can escalate quickly.

Proprietary network continuity model

Electric utility operations managing grid stability & outages

Study, state estimation, and contingency analysis results visualized in real-time

Gas and pipeline control rooms monitoring flow, pressure, & safety conditions

Monitor network topology and flow constraints automatically

Transportation and rail networks coordinating movement & system status

Track unit fuel supply limitations and market pricing dynamics

Manufacturing operations tracking production, assets & facility performance

Validate data quality across all integrated systems

Large campuses and infrastructure hubs managing utilities & operations 

Start Managing Operations the Right Way

By unifying data, simplifying interpretation, and aligning teams around a single operational view, it turns control room technology into something that actually supports decision-making instead of slowing it down. If your current setup feels harder to trust than it should be, it is time to rethink how your control room is structured.

Upgrade your control room technology with a system built for you

Request a Demo

Frequently Asked
Questions

What does this technology actually include?
Primate’s control room technology includes the software and systems used to monitor, visualize, and manage operational data. This often involves SCADA, EMS, GIS, visualization platforms, alerting systems, and display environments that help operators understand system conditions in real time.
Why do control rooms struggle even with advanced systems?
Most systems operate independently and were not designed to work together. Operators are forced to combine information manually, which creates delays and increases the chance of misinterpretation, especially during high-pressure events.
How does Primate improve existing control room technology?
Primate integrates existing systems into a single visual environment, structuring data so operators can understand relationships and system conditions instantly without switching between tools or reconciling multiple data sources.
Can this work with our current infrastructure?
Yes. Primate is designed to integrate with existing operational systems and display environments. It enhances how data is visualized and used without requiring a full replacement of your current infrastructure.
Who benefits most from upgrading control room technology?
Organizations managing complex, real-time operations benefit the most. This includes electric utilities, pipeline operators, transportation systems, and any environment where fast, accurate interpretation of live data directly impacts performance and safety.
Assessment Tool

Is your control room ready for AAR and DLR?

See if your control room is prepared to support AAR and DLR across visibility, data, and operations.

Check Readiness →