
Calculate what one control room event really costs | Try our free ROI calculator


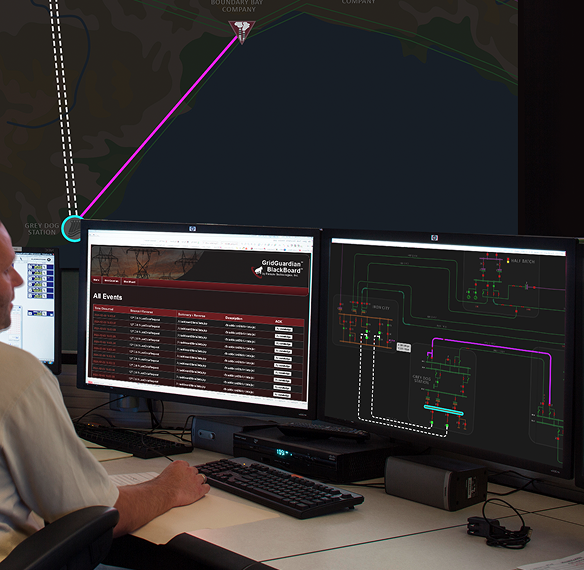
Control rooms must provide clear visibility when conditions change rapidly. Primate delivers an integrated control room for emergency response that consolidates operational, security, and facility systems into a single synchronized view, helping teams understand what is happening and respond with clarity when incidents escalate.


Control rooms are built to monitor operations, but during critical events, multiple systems generate signals at once.
Security alerts trigger. Facility alarms activate. Operational systems report anomalies. Environmental conditions shift. Each system presents its own data, often in separate interfaces.
Operators are left navigating multiple screens to determine what is happening, where it is happening, and how events are connected. As signals increase, clarity decreases. In high-pressure situations, fragmented visibility slows decision-making and increases uncertainty across teams.
Primate transforms the control room by creating a unified operational view across all relevant systems. By aggregating and correlating live data streams, our integrated control room for emergency response allows teams to understand how events relate to each other within a single environment. Control rooms gain visibility across:
Security monitoring systems
Facility and building management systems
Operational systems and infrastructure monitoring
Access control and entry systems
Environmental sensors and condition monitoring
Alerts and event signals across systems
.jpg)
Aggregate security, facility, and operational systems into one synchronized control room view.
Connect related signals across systems to help operators understand how events are linked.
Provide a consistent operational view across control room displays so all teams see the same information.
Visualize systems, assets, and events within their physical location for better situational understanding.
Reduce fragmented alerts by presenting them within a unified operational context.
Render a coherent operational view across control room displays, replacing disconnected dashboards with synchronized information.
Control rooms are tested when multiple systems generate signals at once. With Primate’s integrated control room for emergency response, teams gain the clarity needed to interpret events and coordinate effectively across the control room. You can:
Identify where incidents are occurring across systems
Understand how alerts from different systems are connected
Monitor activity across zones, assets, and infrastructure in real time
Align security, operations, and facility teams around a shared operational view
Maintain visibility as conditions change and events evolve

Control rooms are designed to monitor systems, but their true value is measured during high-pressure situations.
When multiple alerts appear at once, operators need more than raw data. They need to understand what is happening, where it is happening, and how different signals relate to each other.
Primate enables teams to interpret complex situations by presenting correlated data within a single operational view. This helps reduce confusion, improve coordination, and support faster, more confident decision-making when it matters most.
Primate is powered by three core technologies that work together to deliver fast, reliable, and distortion-free visualization for control rooms.
Real-Time Interface
Access critical system information from anywhere through:
Desktop workstations
Video wall displays
Mobile devices
Remote access points
Emergency backup displays
Visualization Processor
Purpose-built for control room environments, delivering:
High-performance graphics processing
Multi-screen synchronization
Interactive control functions
Remote access capabilities
Real-time data updates
Display Engine
Transform complex data into clear visualizations with:
Optimized rendering for any screen size
Seamless zoom level integration
Automatic data point rendering
Lightning-fast navigation
Custom display formatting

Control rooms rely on a range of operational, security, and facility monitoring systems. Primate integrates these inputs into a unified visualization layer, allowing teams to monitor events without replacing existing infrastructure. Deployment includes:
Integration with security, facility, and operational monitoring systems
Real-time data normalization and correlation across systems
Custom visualization design for control room environments
Validation across live operational and high-load scenarios
Continuous system monitoring and technical support
Control rooms should not rely on disconnected dashboards and isolated alerts during critical events. By consolidating security signals, facility data, and operational inputs into one synchronized environment, Primate helps teams maintain clarity, align decision-making, and operate with confidence under pressure.


See if your control room is prepared to support AAR and DLR across visibility, data, and operations.
Check Readiness →