Data Center Visualization Software

Data center operations depend on clear visibility across infrastructure systems, equipment status, and environmental conditions. Primate delivers data center visualization software that consolidates monitoring systems into a single operational view, helping teams understand facility conditions and respond to issues with greater clarity.

Control room operator analyzing real-time system data and geospatial visualization on large displays

From Weeks to Hours: $150K Saved Every Year

Primate’s Network Model lets operators complete grid updates in 4 hours instead of 80, cutting dependency on engineers, eliminating backlogs, and typically saving over $150,000 per year in labor costs.

$150K+

annual labor savings

96%

faster update time

Real-Time Monitoring vs $6.7B Blackout

During the 2003 Northeast blackout, alarm failures left operators blind for over 90 minutes.Primate’s real-time EMS health monitoring would have caught the failure instantly, preventing cascading outages and billions in economic losses.

$6.7B

loss avoided

90+

min faster operator response

Preventing $1M-a-Day Penalties

NERC violations for missed contingencies can cost utilities millions daily. Primate continuously monitors data quality and system limits, instantly flagging potential breaches to help keep operations compliant and penalty-free.

$1M/day

fines prevented

3

key NERC standards covered

One Visualization. $100M in Mission Costs Saved

A detected anomaly nearly grounded a million-dollar launch. Primate’s visualization revealed it was outside the critical zone, preventing an unnecessary cancellation and saving hundreds of millions in wasted preparation.

$100-$150M

loss avoided

0

false aborts

Turning $1.7M Outages Into Minutes of Downtime

Average grid outages last 5.8 hours and cost $1.7M in downtime and penalties. Primate’s fault detection helps operators isolate and resolve issues fast, often restoring power in minutes instead of hours.

$1.7M

saved per outage

5.8hrs = minutes

recovery time

Stopping $300K-an-Hour Downtime Before It Starts

Each hour of downtime costs electric utilities around $300K. Primate’s continuous visualization spots anomalies before they escalate, keeping systems online, reliable, and efficient around the clock.

$300K/hr

loss prevented

24/7

intelligent alarming

Operators in a control room monitoring real-time system data on a large video wall with visual indicators

Data Overload = Visibility Falls Short

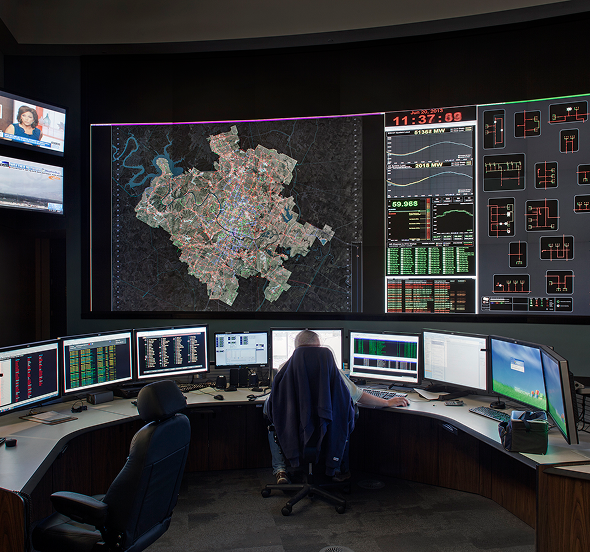
Data centers rely on multiple monitoring systems to track infrastructure performance. Different tools monitor equipment status, environmental conditions, power systems, cooling, and network activity. Each system provides its own data, often through separate dashboards.

Operators must move between these tools to understand what is happening across the facility. Metrics are available, but context is not always clear.

When conditions change or alerts appear, fragmented visibility makes it harder to understand where issues are occurring and how they relate to the broader environment.

One Unified View of Data Center Operations

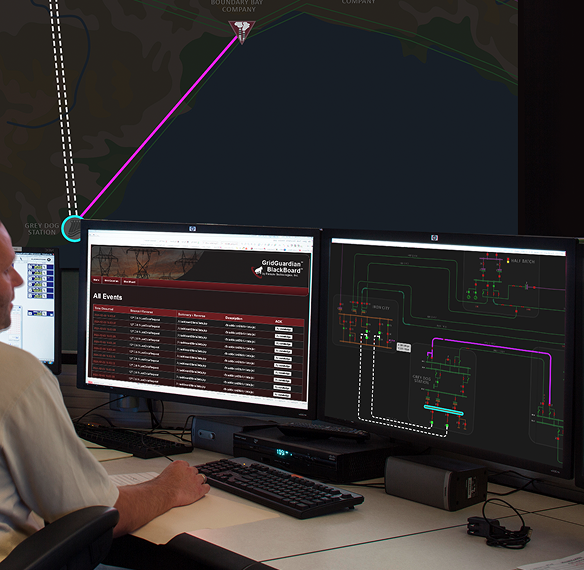
Primate transforms data center visualization by creating a real-time operational picture across the facility. By aggregating and correlating monitoring inputs, Primate enables teams to understand infrastructure conditions within a single environment. Monitoring environments gain visibility across:

Design role-specific operational dashboards

Equipment status and infrastructure monitoring systems

Configure priority-based alert displays

Power and cooling systems

Access historical trends through interactive displays

Environmental conditions and sensor data

Enable team-wide situational awareness with collaborative visualization tools

Network and operational monitoring inputs

Enable team-wide situational awareness with collaborative visualization tools

Facility zones and infrastructure layout

Ready to gain full visibility across your data center?

Key Capabilities for Data Center Visualization

Icon of connected nodes representing unified control room integration

Integrated Infrastructure Data

Aggregate monitoring inputs across systems into one operational environment.

Lock icon with a plus sign symbolizing physical and cyber security monitoring

Real-Time Facility Visibility

Monitor equipment status, environmental conditions, and infrastructure systems in real time.

magnifying glass icon representing geospatial and external data integration

Alert Context Visualization

Present alerts within a unified view so teams can understand their relevance to overall ops.

Bar chart icon symbolizing complex network data analysis for decision-making

Geospatial Facility Mapping

Visualize infrastructure within the physical layout of the center for better awareness.

Stacked documents icon representing seamless access to crucial system insights

Cross-System Monitoring

Combine multiple monitoring systems into a single, consistent operational view.

Stacked documents icon representing seamless access to crucial system insights

Operational Clarity at Scale

Maintain clear visualization across large environments and multiple facility zones.

Where Data Center Visualization Matters Most

Data center environments require continuous monitoring across infrastructure, equipment, and environmental conditions. With Primate, teams gain the visibility needed to understand facility conditions and respond to issues more effectively. You can:

Design role-specific operational dashboards

Monitor equipment status across racks and facility zones

Configure priority-based alert displays

Track environmental conditions alongside infrastructure performance

Access historical trends through interactive displays

Identify where alerts are occurring within the data center

Enable team-wide situational awareness with collaborative visualization tools

Maintain visibility across multiple areas of the facility

Enable team-wide situational awareness with collaborative visualization tools

Align teams around a shared operational view of system conditions

Operators in a control room monitoring real-time system data on a large video wall with visual indicators

Understand Infrastructure as a Connected System

Data center operations are not just about individual metrics. They are about understanding how infrastructure systems behave together.

Primate enables teams to visualize equipment status, power conditions, cooling systems, and environmental inputs within a single operational view. When conditions change, teams can see how different systems relate and where issues may impact overall operations.

By presenting infrastructure data in context, Primate helps teams interpret system behavior more clearly and maintain stable operations.

Performance-Driven Display Technology

Primate is powered by three core technologies that work together to deliver fast, reliable, and distortion-free visualization for control rooms.

TileViewer

Real-Time Interface

Access critical system information from anywhere through:

Desktop workstations

Desktop workstations

Video wall displays

Video wall displays

Mobile devices

Mobile devices

Remote access points

Remote access points

Emergency backup displays

Emergency backup displays

Learn More

BlackBoard™

Visualization Processor

Purpose-built for control room environments, delivering:

High-performance graphics processing

High-performance graphics processing

Multi-screen synchronization

Multi-screen synchronization

Interactive control functions

Interactive control functions

Remote access capabilities

Remote access capabilities

Real-time data updates

Real-time data updates

Learn More

TileBuilder

Display Engine

Transform complex data into clear visualizations with:

Optimized rendering for any screen size

Optimized rendering for any screen size

Seamless zoom level integration

Seamless zoom level integration

Automatic data point rendering

Automatic data point rendering

Lightning-fast navigation

Lightning-fast navigation

Custom display formatting

Custom display formatting

Learn More
Wind farm with overlaid data graphs, representing intelligent data processing and real-time analytics

Built to Integrate with Data Center Systems

Data center monitoring environments rely on multiple infrastructure and monitoring platforms. Primate integrates these inputs into one synchronized visualization layer, allowing teams to monitor operations without replacing existing tools. Deployment includes:

Proprietary network continuity model

Integration with infrastructure and monitoring systems

Study, state estimation, and contingency analysis results visualized in real-time

Real-time data normalization and correlation across inputs

Monitor network topology and flow constraints automatically

Custom visualization design for data center environments

Track unit fuel supply limitations and market pricing dynamics

Validation across live operational conditions

Validate data quality across all integrated systems

Continuous system monitoring and technical support

Maintain Clear Visibility Across Your Data Center

Data center visualization should not rely on disconnected dashboards and isolated metrics. By consolidating infrastructure monitoring inputs into one synchronized environment, Primate helps teams maintain visibility, understand system conditions, and respond to issues with greater confidence.

Ready to improve your data center visualization?

Request a Demo
Assessment Tool

Is your control room ready for AAR and DLR?

See if your control room is prepared to support AAR and DLR across visibility, data, and operations.

Check Readiness →