Calculate what one control room event really costs | Try our free ROI calculator


Explore 3 key benefits of custom dashboards for power grid control rooms, from better awareness to future-ready flexibility.
July 23, 2025

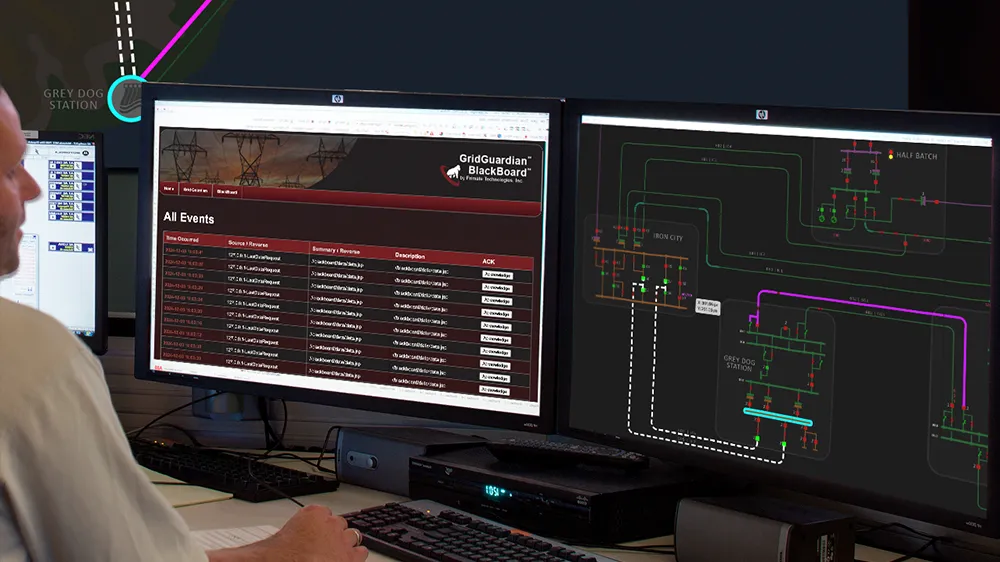
In modern power grid operations, the control room serves as the brain of the entire electrical network. Operators are expected to make high-stakes decisions in real time, often under pressure. At the center of these decisions are dashboards: visual interfaces that aggregate, organize, and present complex system data. While standard displays may offer out-of-the-box convenience, custom dashboards provide critical advantages for utilities managing large, dynamic grids.
In this article, we’ll explore the top three benefits of custom dashboards compared to standard displays, specifically in the context of power grid operations. Whether you're a utility executive, control room operator, or systems engineer, understanding the value of custom visualization tools can directly impact operational awareness, system reliability, and regulatory compliance.
Standard dashboards typically use pre-defined templates that assume a generalized workflow. However, no two control rooms, or grid conditions, are exactly alike. Custom dashboards allow organizations to design interfaces based on their specific operational needs, asset types, and response protocols.
For example, a utility managing both transmission and distribution systems may need to correlate SCADA data with weather inputs, asset status, and load forecasts in real time. Custom dashboards can prioritize this information using tiered alerting systems, geospatial overlays, and role-based views. Operators can see exactly what matters most, without digging through nested menus or interpreting generic indicators.
This contextual precision enhances situational awareness, enabling faster, more informed decisions in normal and emergency conditions alike.
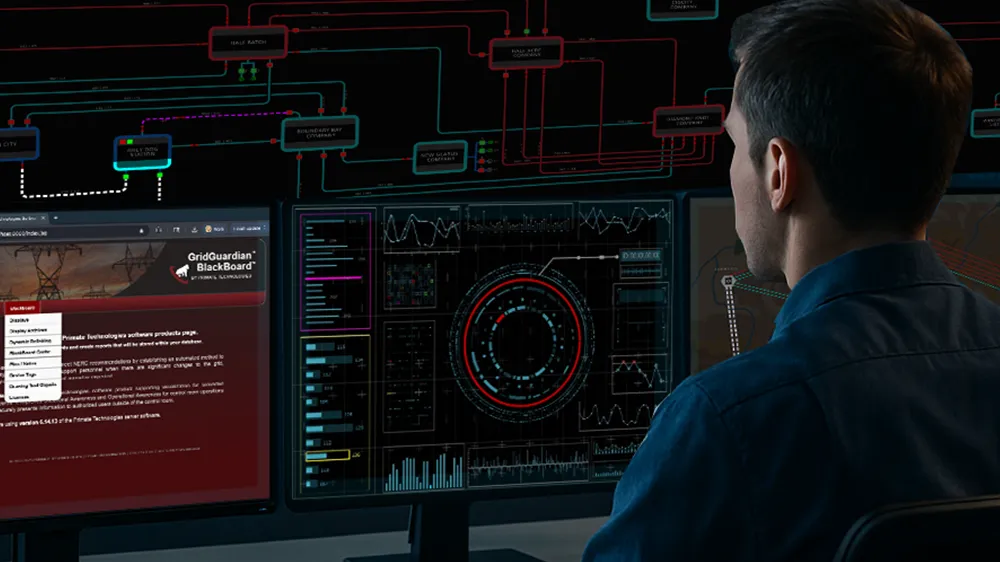
Power grid control rooms rely on data from many sources: SCADA, EMS, outage management, GIS, weather systems, generation forecasts, and more. Standard displays often struggle to integrate this data meaningfully. As a result, operators are forced to “dashboard hop” or monitor multiple screens, increasing mental strain and the risk of error.
A custom operational dashboard can serve as a unified interface, pulling data from disparate systems and presenting it in an intuitive, interactive format. Instead of toggling between silos, users gain a holistic view of grid health in one place.
The cognitive benefit of this integration is substantial. Fewer screens, better alignment between data and operator roles, and clearer visualization logic all contribute to lower operator fatigue and higher response accuracy, especially during abnormal operating conditions.
As the electric grid evolves, with new DERs (Distributed Energy Resources), renewable integration, and increased automation, dashboards must keep pace. Standard displays are typically built with fixed data schemas and UI frameworks, making them harder to adapt as the system evolves.
By contrast, custom dashboards are designed with modularity in mind. This means utilities can adjust interface layouts, data streams, visual elements, and analytics models over time, without replacing the entire system. Whether incorporating real-time analytics, AI-based forecasting, or distributed control metrics, custom dashboards provide the flexibility needed for grid modernization.
Moreover, custom solutions often allow for user-configurable views, so that system operators, engineers, and planners can each access the visual intelligence most relevant to their responsibilities, without sacrificing consistency across the organization.
Custom dashboards are no longer a luxury, they’re becoming a necessity for operational resilience and efficiency in today’s complex power grid environments. Compared to standard displays, custom solutions offer superior situational awareness, integrated decision support, and future-ready adaptability.
For utilities committed to reliability, safety, and regulatory compliance, the investment in custom operational dashboards is a strategic step forward.


See if your control room is prepared to support AAR and DLR across visibility, data, and operations.
Check Readiness →