Calculate what one control room event really costs | Try our free ROI calculator


Discover the critical differences between data integration and data visualization in power grid operations. Learn how these complementary technologies work together to enhance control room efficiency, improve decision-making, and meet the challenges of today's complex energy landscape.
May 6, 2025


In today's complex energy landscape, control room operators face increasing pressure to manage vast volumes of data with speed, precision, and clarity. Two crucial concepts that enable operational excellence in power grid control rooms are data integration and data visualization. Although they are often discussed together, they serve distinct roles. Understanding the difference between data integration and data visualization is essential for building resilient, efficient, and intelligent grid operations.
Data integration refers to the process of combining data from multiple sources into a unified, consistent view. In the context of power grid operations, this may include merging data streams from SCADA systems, outage management systems (OMS), energy management systems (EMS), geographic information systems (GIS), and other third-party tools.
Successful data integration ensures that operators are working with accurate, up-to-date information without the need to manually toggle between disparate platforms. It centralizes critical operational data, enabling faster decision-making, predictive analytics, and cross-system insights.
For control rooms, real-time data integration is mission critical. Anomalies in system parameters, unexpected equipment failures, or weather-related disruptions can only be understood and addressed quickly when data flows seamlessly across systems.
Data visualization, on the other hand, is about how this integrated data is displayed and interpreted. Visualization transforms raw data into intuitive, graphical formats such as dashboards, maps, charts, trends, and logic driven displays.
In a power grid control room, visualization tools make it possible for operators to:
Without effective control room visualization, even the best-integrated data becomes overwhelming. Operators require clear, actionable displays to make real-time decisions that uphold grid reliability and security.
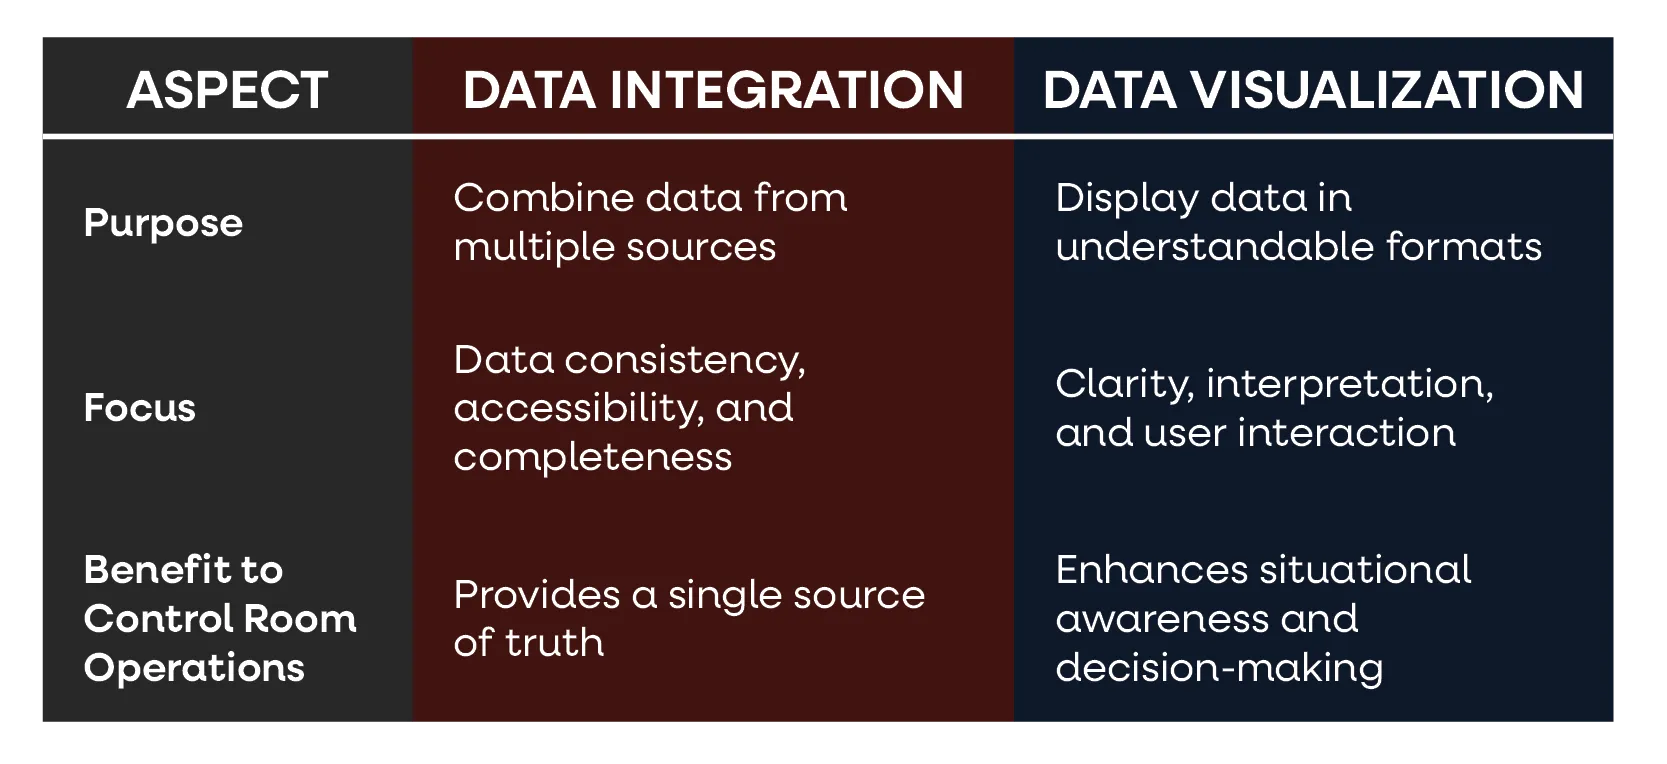
In essence, data integration makes sure the right information is available, while data visualization makes sure the information is understood and acted upon correctly.
Primate Technologies recognizes that superior control room performance hinges on the synergy between data integration and data visualization. You cannot have one without the other when optimizing power grid operations.
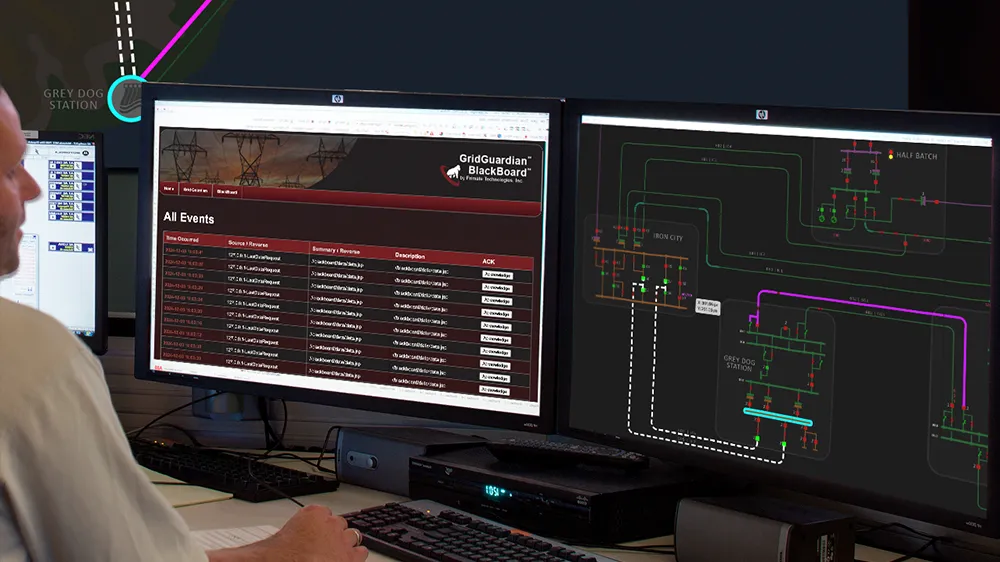
An integrated control room visualization system receives data from multiple sources, processes it rapidly, and presents it through intuitive visual interfaces. This holistic approach enables grid operators to maintain situational awareness, improve response times, and support grid stability—especially during peak load events, outages, or cybersecurity incidents.
Moreover, as distributed energy resources (DERs), electric vehicles (EVs), and microgrids increase grid complexity, the need for seamless data integration and sophisticated visualization grows exponentially. Modern control rooms must evolve beyond siloed systems and basic schematics to deliver predictive insights and real-time collaboration across teams.
Understanding the difference between data integration and data visualization is critical for advancing control room operations in the energy sector. Integration ensures that operators are not missing vital pieces of the puzzle; visualization ensures they can see the entire picture clearly and act swiftly.
Organizations investing in both robust data integration frameworks and advanced control room visualization technologies will be better positioned to meet the challenges of a dynamic, digital grid.
Looking to learn more about elevating your control room's visualization capabilities? Contact our experts today!


See if your control room is prepared to support AAR and DLR across visibility, data, and operations.
Check Readiness →